Users can choose the mouse, keyboard, and sliders for panning and zooming a map.
Click & Drag the mouse to pan
Mouse Scroll Forward to zoom in
Mouse Scroll Backward to zoom out
SHIFT + Click & Drag the mouse to draw a box and zoom in
SHIFT + CTRL + Click & Drag the mouse to draw a box and zoom out
SHIFT + Click to recenter on clicked location
Use arrow keys to pan
Use + key to zoom in a level
Use - key to zoom out a level
Hints and Tips
Use the LayerList to turn layers on and off.
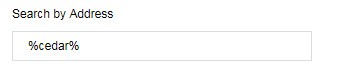
Search by address or parcel number by clicking the magnifying glass.
To find all addresses on a certain street, place "%" (percent symbol) around the street name.
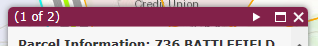
If more than one layer is visible, you can cycle through the selection by using the arrows at the top of the pop-up window.
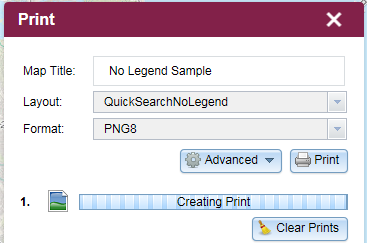
For the best printing results, make sure to check your printer properties. A sample using the "QuickSearchLegend" layout settings can be found by clicking here.
If you are using the measuring tools, set all of your variables before drawing your shape, and check the box to show measurements.
Clicking "ZOOM TO" will zoom to the selected feature.
Click the arrow in the top right corner to see the overview map and quickly navigate across large areas.
Coordinates are in decimal degrees and can be obtained by clicking on the crosshairs and then clicking on the map. This will lock the coordinates which can be highlighted and copied.
Parcel lines are not exact. If you need access to land records, please visit Chesapeake Clerk of Circuit Court Remote Access site.
Using the search only zooms to the location. Once at the location, please click on the property to get more information.
Search
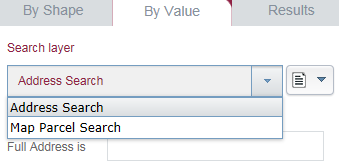
The Search widget allows the user to find parcels using various methods.
The default search allows you to search the parcel information layer by entering an address or map parcel number.
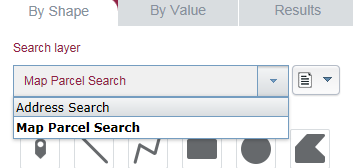
Searching "By Shape" allows you to select multiple parcels and find their address or map parcel Number.
Click on any of the shapes, check any of the boxes if needed, focus on the map and follow the on-screen instructions to select parcels. Please view the embedded video for an example.
Both search functions allow multiple selection types including adding and removing items from existing selections. Please view the embedded video for examples of selecting.
Drawing Tools (Measure and Select)
Drawing in ArcGIS Web Applications
The Draw widget enables end users to draw simple graphics and text onto the map display.
It provides basic sketching and redlining functionality for ArcGIS web applications.
For example, to snap a node to a node of another feature, press the Ctrl key to enable snapping.
It also provides some measurement capability by displaying measurement values (if activated) for drawn features:
lengths for lines, and areas and perimeters for polygons. When the widget is initially activated, the end user is
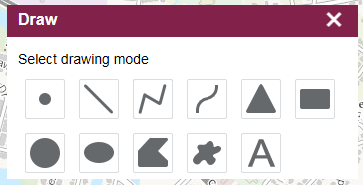
presented with a dialog box that contains nine feature creation tools. From left to right, they are as follows:
point
polyline
freehand line
rectangle
circle
ellipse
polygon
freehand polygon
text
Drawing tools are saved to the layer list widget in each session.
If the page is refreshed, all drawing features will be cleared from the user's session.
When adding text, the text will be centered on where the point was clicked on the map.
Measurements are added to the center of features.
Please view the video below to see an example of using the drawing tools.
Note: For measurement options to appear for a feature, they need to be set before a feature is created to display on the map. Line features have
a length, polygon features have an area and a perimeter.
To remove the newly added feature (or text), click Clear drawings (Caution: This will remove all features and text from the display).
Measurements are not exact and are made using a Web Mercator projection.
Printing
Click the Print icon to create simple prints if needed.
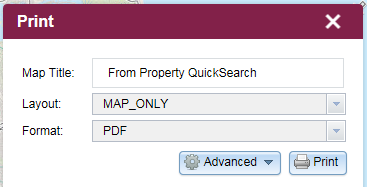
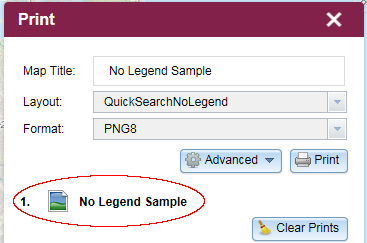
The print dialogue looks like this by default.
Change the "Map Title" to create a title when the map is printed.
Change the "Format" to fit the needs of your print. There are a variety of popular formats available.
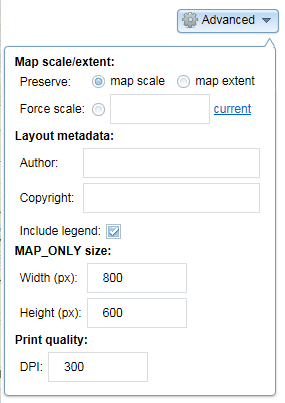
The "Advanced" button allows you to further make changes if needed.
Click the "Print" button to start generating your file.
Click the title of your print to open the file.